Device State & Diagnostics
When a robot stops in an aisle or a kiosk goes dark, the first question is why. Every current Admiral device continuously reports a structured state: what it is running, whether it has applied its latest configuration, how it is connected, how its storage and clock are doing, why it last rebooted, and what it is downloading or installing right now. Admiral Cloud turns that into a one-glance diagnosis, and you can ask an online device to run a live probe on demand.
Everything on this page works from the dashboard, the CLI, the REST API, and the MCP server (invite only).
The Diagnostics Tab
Open a device and choose Observe > Diagnostics. The tab has five cards, top to bottom.
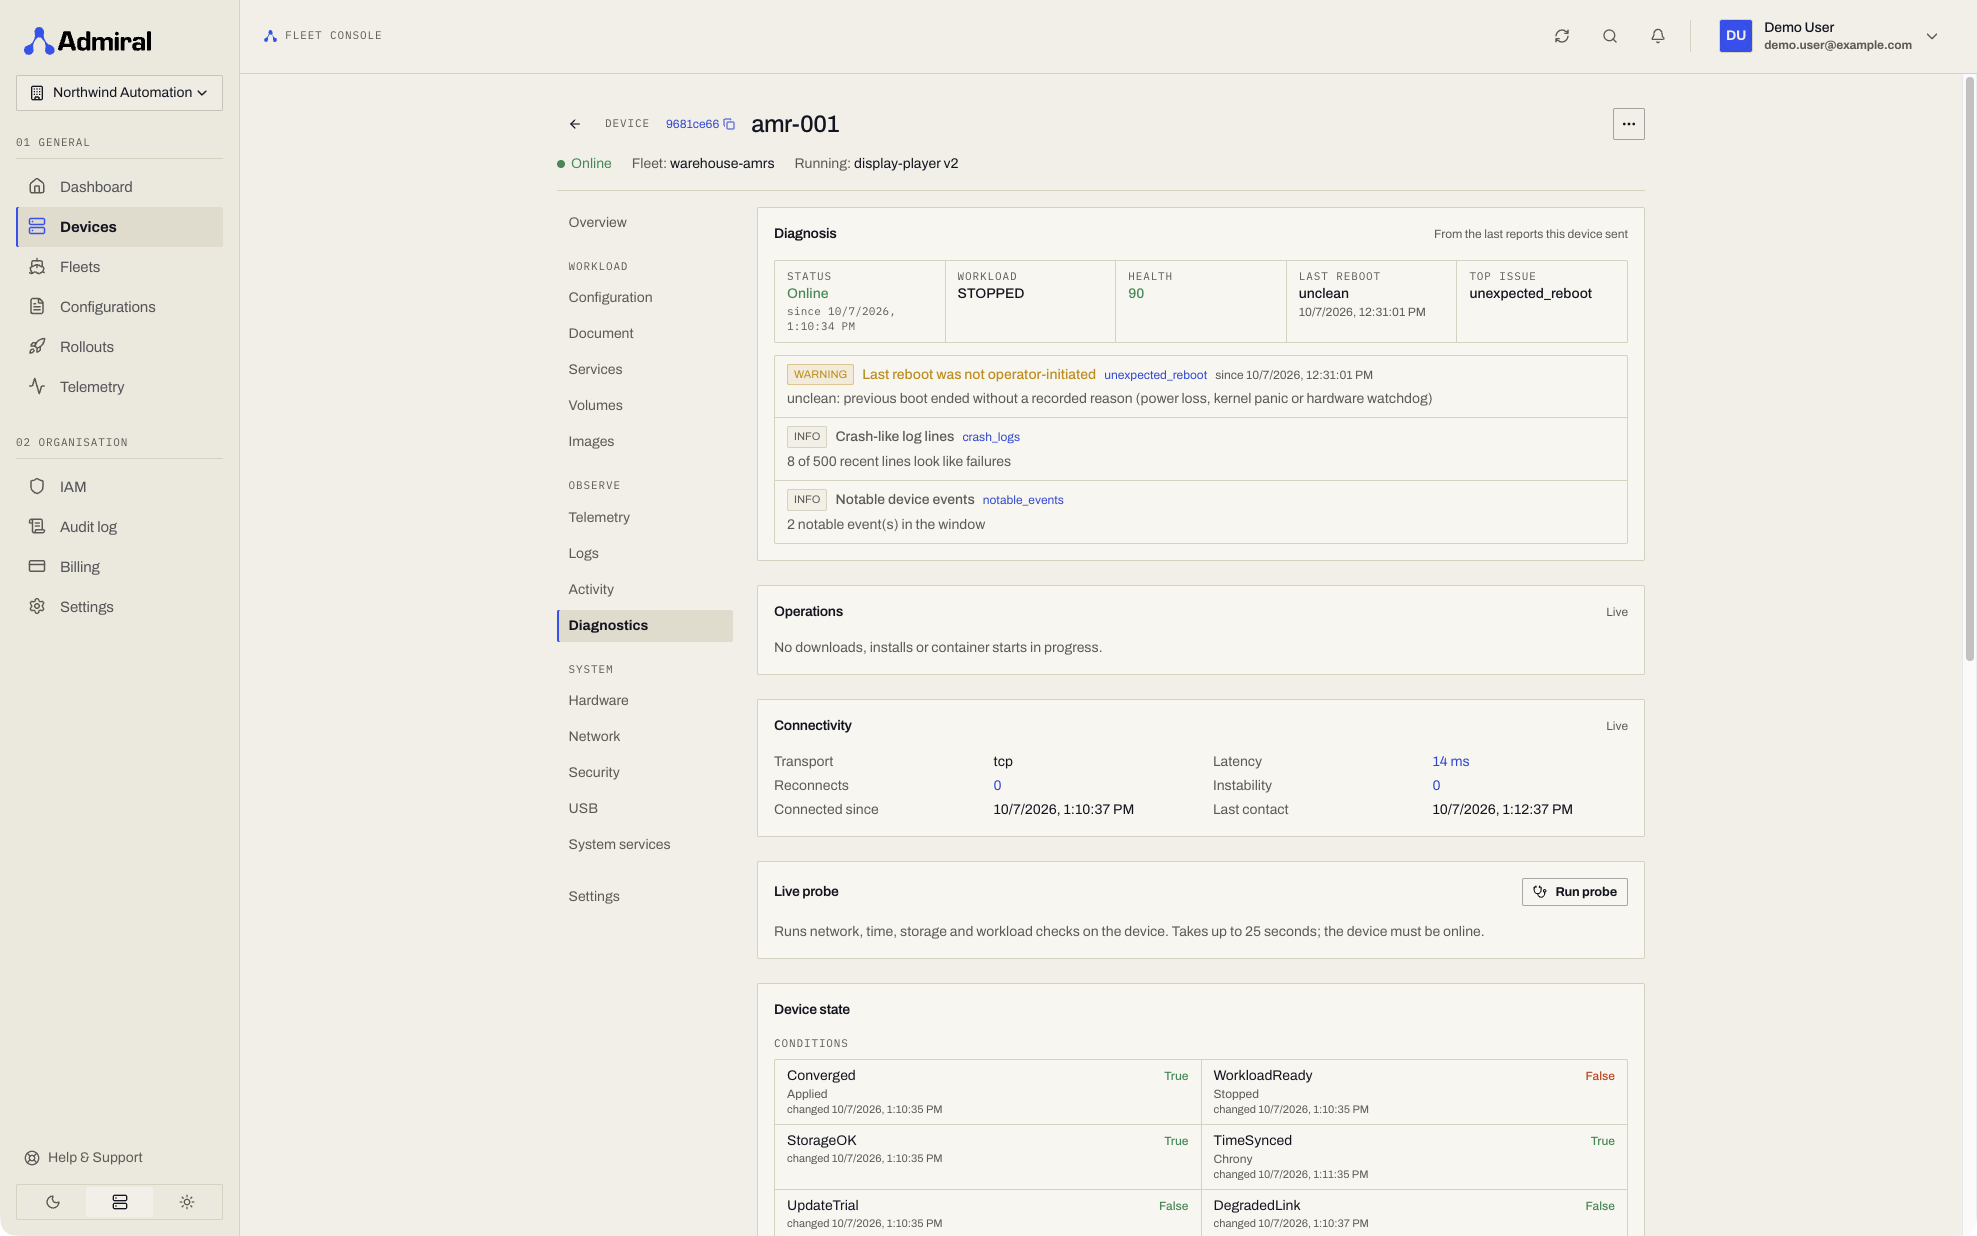
1. Diagnosis
Built from the last reports the device sent, so it is instant and works for offline devices too. Nothing is sent to the device.
The verdict strip shows:
| Tile | Meaning |
|---|---|
| Status | Online or Offline, and since when. |
| Workload | The workload state (for example running, crashing). Shows in transition with a duration when the workload has been starting or updating for a while. |
| Health | A score from 0 to 100. Green at 80 and above, amber from 50, red below. Only warnings and critical issues lower it. |
| Last reboot | Why the device last restarted (see Boot reasons). |
| Top issue | The most severe issue found, or None. |
Below the strip, each issue has a severity (critical, warning, info), a title, a short code, when it started, and a detail line. The issues Admiral looks for:
| Code | Title | What to do |
|---|---|---|
device_offline | Device is offline | Check power and network on site. The detail shows when it was last seen. |
workload_crashing | Workload is crash-looping / keeps failing | Open Observe > Logs for the workload output; check the image and command. |
workload_error | Workload reported an error | The detail carries the error the device reported (image pull, mount, start). |
workload_rollback | Workload rolled back | The device returned to the previous configuration on its own. See Automatic Workload Rollback. |
workload_oom | Workload was OOM-killed | The container ran out of memory. Reduce memory use or move to larger hardware. |
image_signature | Image signature verification failed | The image does not satisfy the fleet's signature policy. |
stuck_transition | Workload transition is stuck | A start or update has not finished after 10 minutes, often a slow or blocked image download. |
unexpected_reboot | Last reboot was not operator-initiated | Power loss, a watchdog, or a crash restarted the device. See the boot-reason journal. |
wss_fallback | Device is on the WebSocket fallback | The site blocks the direct transport; the device is connected through its fallback path. Usually a firewall rule. |
disk_level | Filesystem filling up / nearly full | Warning at 85 %, critical at 95 %. Clean up volumes or images. |
mount_mode | Unexpected mount mode | A filesystem is read-only when it should be writable, or the reverse. |
time_not_synced | Clock not synchronised | The device cannot reach a time source. TLS and token checks depend on the clock. |
rtc_drift | Hardware clock drift | The battery-backed clock is far from network time; the RTC battery may be failing. |
pending_trial | Update awaiting confirmation | A system update is booted on trial and not yet confirmed good. |
failed_updates | Updates rolled back on this device | A system update failed its trial and the device returned to the previous version. |
version_floor_breach | Below the minimum supported version | The device runs a release older than your organisation's minimum. |
crash_logs | Crash-like log lines | Recent logs contain panics, segfaults, or similar patterns. |
notable_events | Notable device events | Recent lifecycle events worth a look. |
metric_health | Metric health issue | A telemetry threshold (CPU, memory, temperature) is out of range. |
no_observed_state | No observed state yet | The device has not reported state, usually an older Admiral OS release. |
2. Operations
Long-running work on the device, live: image pulls, image extraction, system update downloads and installs, container creation and start, secret delivery, slot repair, and storage checks. Each operation shows a progress bar, bytes or layers done, transfer rate, and time remaining. A system update that is downloaded and waiting for the maintenance window shows as Waiting for update window. Failed operations turn red with the error. Finished operations stay visible for about a minute.
The same bars appear on the device Overview under the workload status, and per device on the rollout detail page, so a slow download on a cellular site is visible as it happens instead of looking like a hang.
3. Connectivity
How the device is connected to Admiral Cloud right now: transport (tcp, kcp, or wss; wss is shown amber because it means the faster paths are blocked), latency, reconnects, an instability counter, when the current connection started, and the last contact. The card says Live while the page is receiving the device's state stream.
4. Live probe
Run probe asks the device to check itself now: network and reachability, time, identity and provisioning, wireless and Bluetooth, storage, boot and kernel, thermal, the workload, and system services. Each item is coloured by level (ok, info, warn, error), with a hint next to warnings and errors. The header shows the overall result, when the report was generated, and how long it took.
![Live probe report: sections coloured by level, one [redacted] value](/assets/images/device-diagnostics-probe-5e1e5c9f251b88e207baec5b7d36a6a7.png)
- The device must be online. The probe takes up to 25 seconds.
- One probe per device every 5 seconds, shared by everyone looking at that device. A second click inside that window says A probe ran a moment ago; wait a few seconds and try again.
- Device is busy, try again shortly means another probe is already running on it.
- Redaction: a few values are only visible to the Admiral support team and show as
[redacted]: the HTTP proxy URL (it can contain credentials), the Wi-Fi network name, the device's mesh key, the kernel command line, and Admiral Cloud endpoint hostnames. Your own interfaces, addresses, gateway, DNS, organisation, and fleet are always visible. Redaction happens in Admiral Cloud before the report reaches your browser.
5. Device state
The full reported state, grouped:
- Conditions: the device's verdicts, each
True,False, orUnknown, with a reason and when it last changed (see below). - Runtime: workload state, the configuration and version running, whether the assigned config is the one applied, failure count, last exit code and time, out-of-memory kills, the health of the workload network bridge, and the image digest.
- Boot: active slot, next and known-good slots, boot time, bootloader, Secure Boot, any pending update trial, the last slot repair, and Failed updates with versions and reasons.
- Boot-reason journal: the device's last reboots, newest first (see below).
- Storage: each filesystem's usage, read-only or read-write (and what it should be), and its level.
- Time: synced or not, offset, hardware clock drift (or No RTC), and stratum.
Conditions
| Condition | True means | Look at it when |
|---|---|---|
| Online | Admiral Cloud has heard from the device recently (added by Admiral Cloud, not the device). | The device dropped off. |
| Converged | The device has applied the latest desired state from its document. | A change or rollout has not taken effect. |
| WorkloadReady | The workload container is running and not crashing. | The application is down. |
| StorageOK | Every filesystem is below its warning level and mounted as expected. | Writes are failing or the disk is full. |
| TimeSynced | The clock is synchronised. | TLS errors or token rejections. |
| UpdateTrial | A system update is booted on trial (True while pending). | After a system update. |
| DegradedLink | The device is on its fallback transport or its connection is unstable. | Slow or flapping connections. |
| DiagnosticsMode | The device is in diagnostics mode (support use; the workload is stopped). | The workload is unexpectedly stopped. |
| LocalOverride | Settings were changed on the device and override the assigned ones. See Local Overrides. | The device is not using the network you assigned. |
Boot Reasons
Each device keeps a journal of why it rebooted and ships it to Admiral Cloud when it reconnects, so the reason survives the reboot itself:
| Kind | Cause |
|---|---|
remote_reboot, remote_shutdown | Someone rebooted or shut it down from Admiral Cloud. |
update | The final step of a system update. |
restart_init | The Admiral manager was restarted. |
console | Rebooted from the on-device console or power key. |
factory_reset | Wiped or unpaired. |
watchdog_no_backend | No contact with Admiral Cloud for an hour; the connectivity watchdog rebooted it. |
deadman | No contact for three days; the long-term safety reboot. |
emergency, kernel_fatal, agent_fatal | The platform detected a fatal condition and rebooted to recover. |
rollback | The bootloader returned to the previous system slot after a failed update. |
unclean | Nothing was recorded: power loss or a kernel panic. |
Other Places State Shows Up
- Overview: the workload status card shows live operations; the performance card lists health issues and warnings from telemetry.
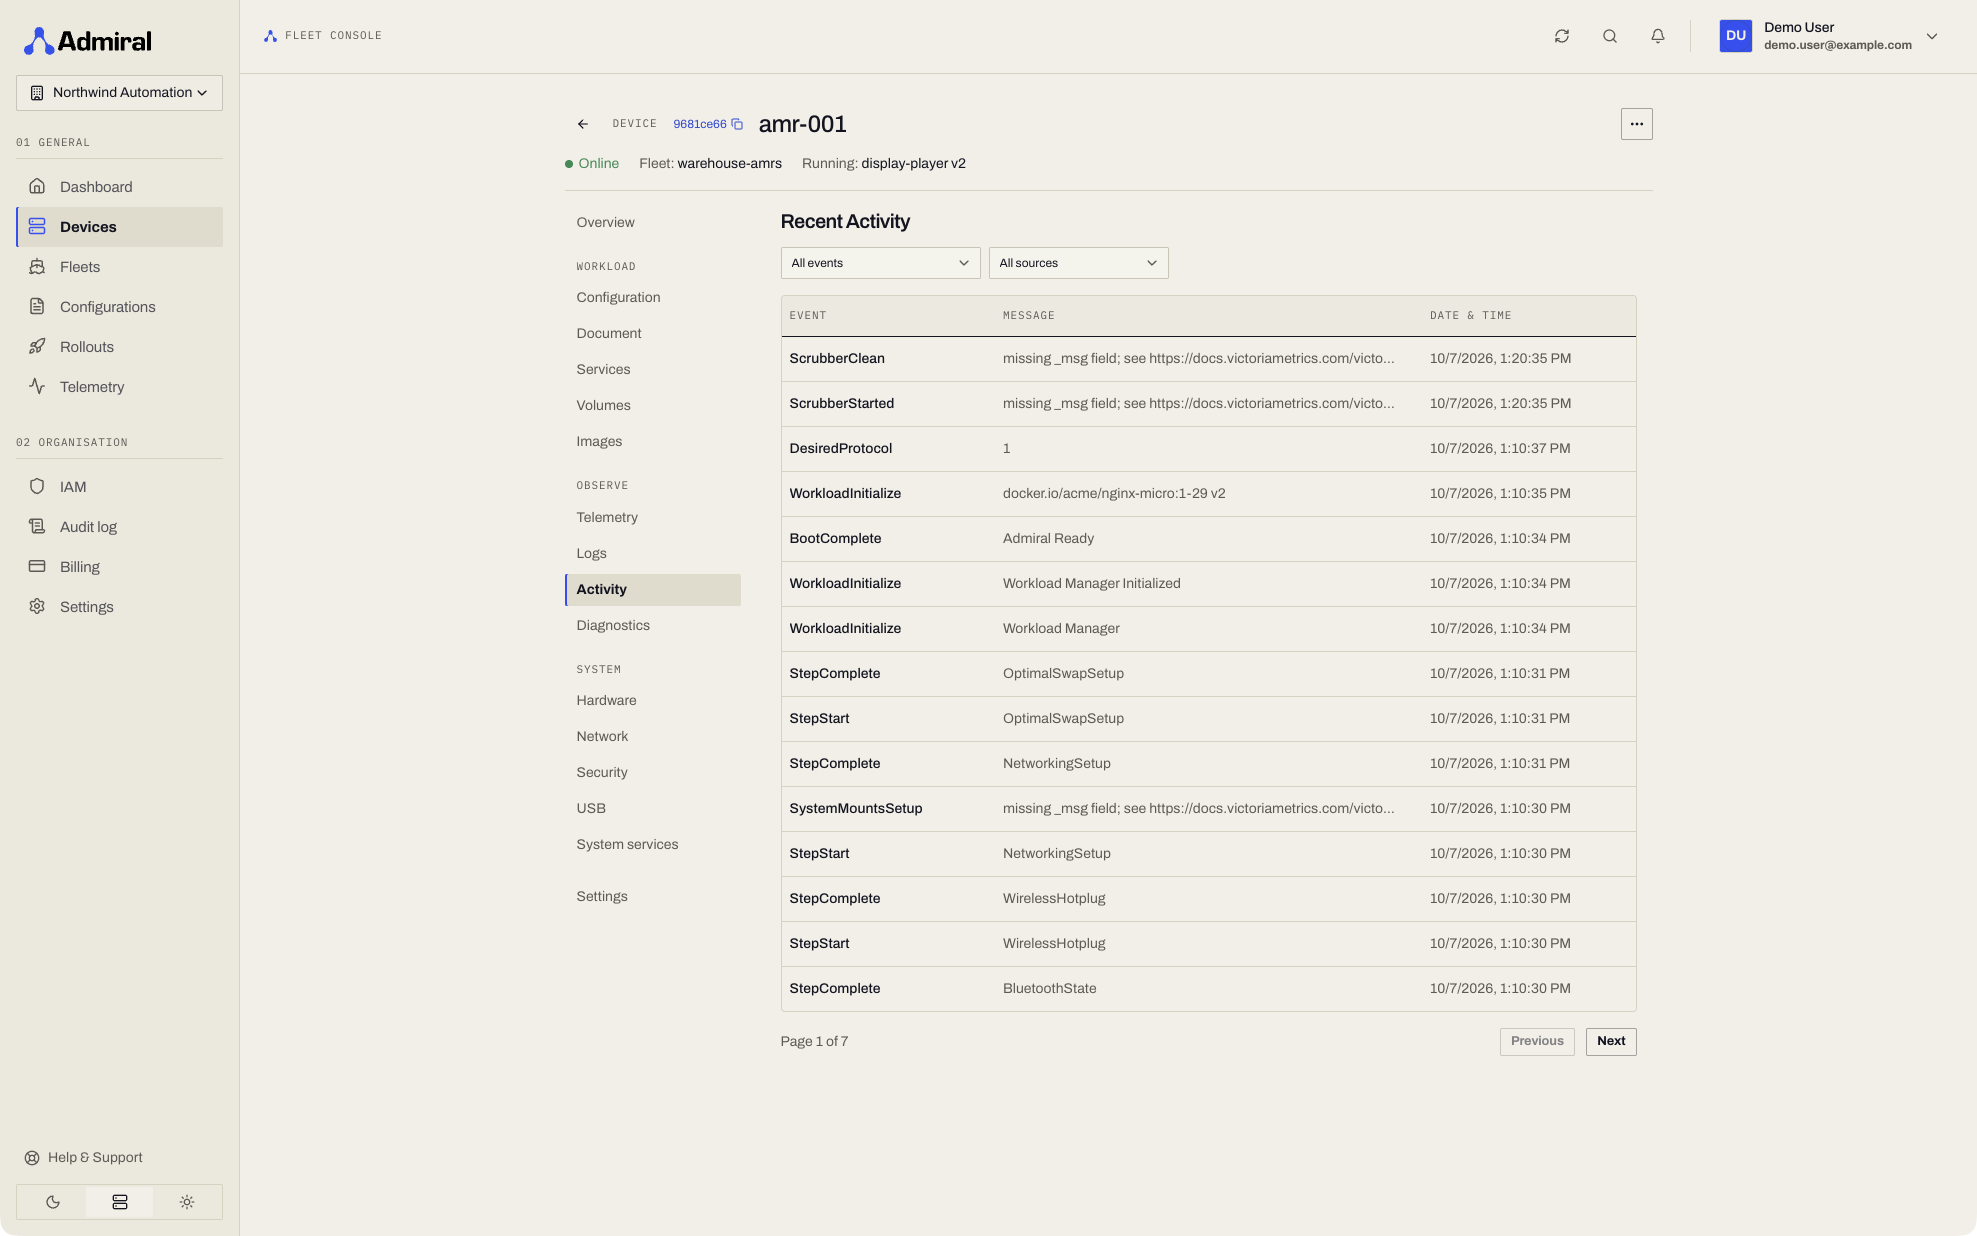
- Observe > Activity: filter the event list by event and by source.
- Header banners: the local-override banner and the workload transition banner (Updating v6 → v7: Pulling image...).
From the CLI
admrl diagnose device amr-dock-07          # verdict and issues
admrl state device amr-dock-07             # last reported state
admrl state device amr-dock-07 --live      # ask the device now
admrl probe device amr-dock-07             # live probe, all sections
admrl probe device amr-dock-07 --section network --section time
admrl watch device amr-dock-07             # stream condition changes and progress
admrl watch prints one line per change, for example a condition flipping False -> True or an operation's progress (image_pull 41% 12 MB/s eta 20s layer 3/5). Press Ctrl-C to stop.
API
| Method and path | Purpose |
|---|---|
GET /v1/devices/{id}/state | Last reported state (conditions, workload, boot, transport, time, storage, progress, boot reasons). |
GET /v1/devices/{id}/state?live=1 | Ask the device now. Limited to one call per 5 seconds per device (429 rate_limited with Retry-After). |
GET /v1/devices/{id}/state/stream | Server-sent events: every state change and progress update. Keepalive every 25 seconds; the stream closes after 30 minutes and clients reconnect. |
GET /v1/devices/{id}/diagnose | Verdict, issues, last reboot, and signals. Stored data only. |
POST /v1/devices/{id}/diagnostics/probe | Run the live probe. One per 5 seconds per device. |
Errors from calls that reach the device are consistent everywhere: 503 device_offline, 504 device_timeout, 502 device_error, 409 device_busy, 429 rate_limited.
Volumes, images, services, and network status reads now answer from the device's last reply (with a reportedAt time) when it is recent, so pages load even when the device is slow or offline. Add ?live=1 to force a fresh round trip.